The market seems to be in a consolidation phase, with 21,900 acting as a strong immediate support for the Nifty 50, and 22,200 as a key hurdle on the higher side, especially ahead of the FOMC meet outcome due on March 20. Hence, unless and until the index breaks on either side of this range, the directionless trade may continue, experts said, adding the breaking of 21,900 can drag the Nifty 50 down up to 21,500, and decisively climbing above 22,200 can take it towards a record high.
On March 18, the benchmark indices showed a smart recovery from the day's low. The Nifty 50 climbed 32 points to 22,056 and formed a small bullish candlestick pattern with upper and lower shadows on the daily charts, indicating volatile trade.
The BSE Sensex rose 105 points to 72,748, while the Nifty Midcap 100 and Smallcap 100 indices underperformed benchmarks, falling 0.4 percent and 0.6 percent respectively.
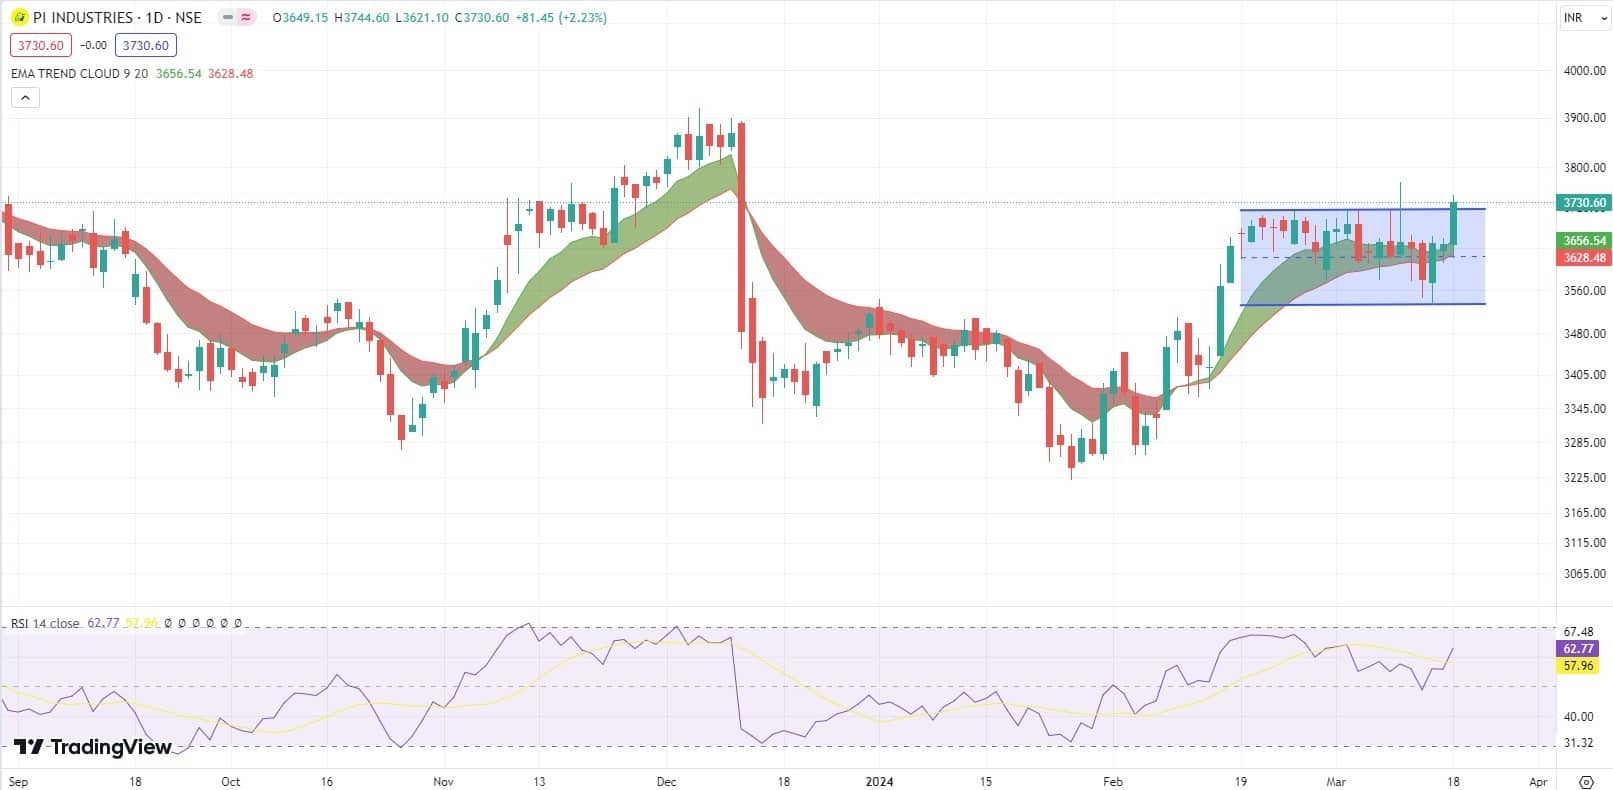
Stocks that outperformed the broader markets and recorded healthy gains on Monday included PI Industries, Godfrey Phillips, and Linde India. PI Industries has seen a breakout of a horizontal resistance trendline adjoining multiple touchpoints and jumped 2.2 percent to Rs 3,731 after several days of consolidation. The stock has formed a long bullish candlestick pattern on the daily charts with average volumes.
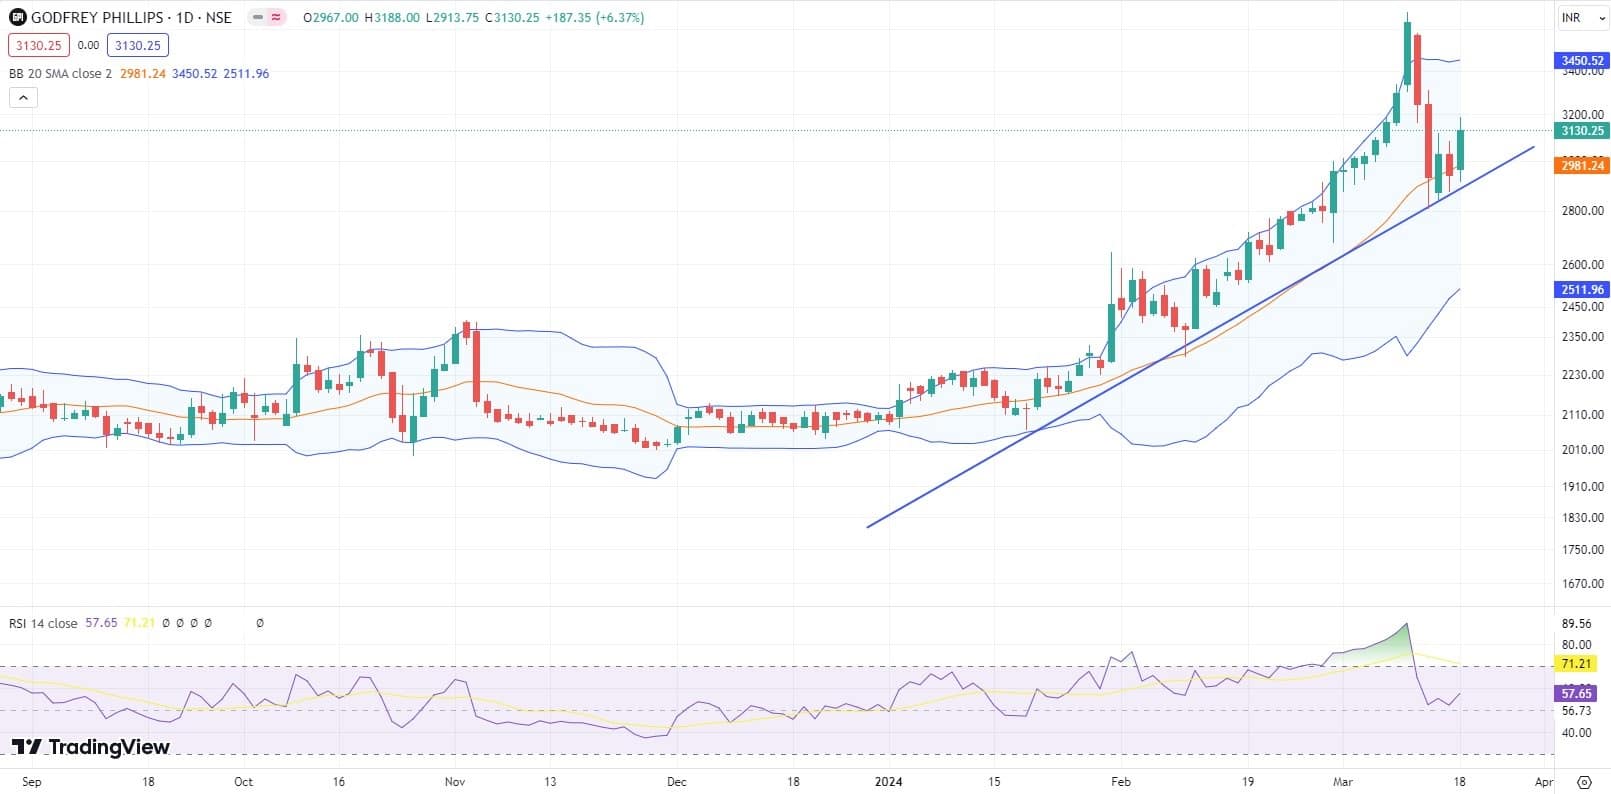
Godfrey Phillips rallied 6.4 percent to Rs 3,130 and formed a long bullish candlestick pattern on the daily timeframe with high volumes. Now the stock traded above all key moving averages, with 21-day EMA acting as a strong support for several weeks now.
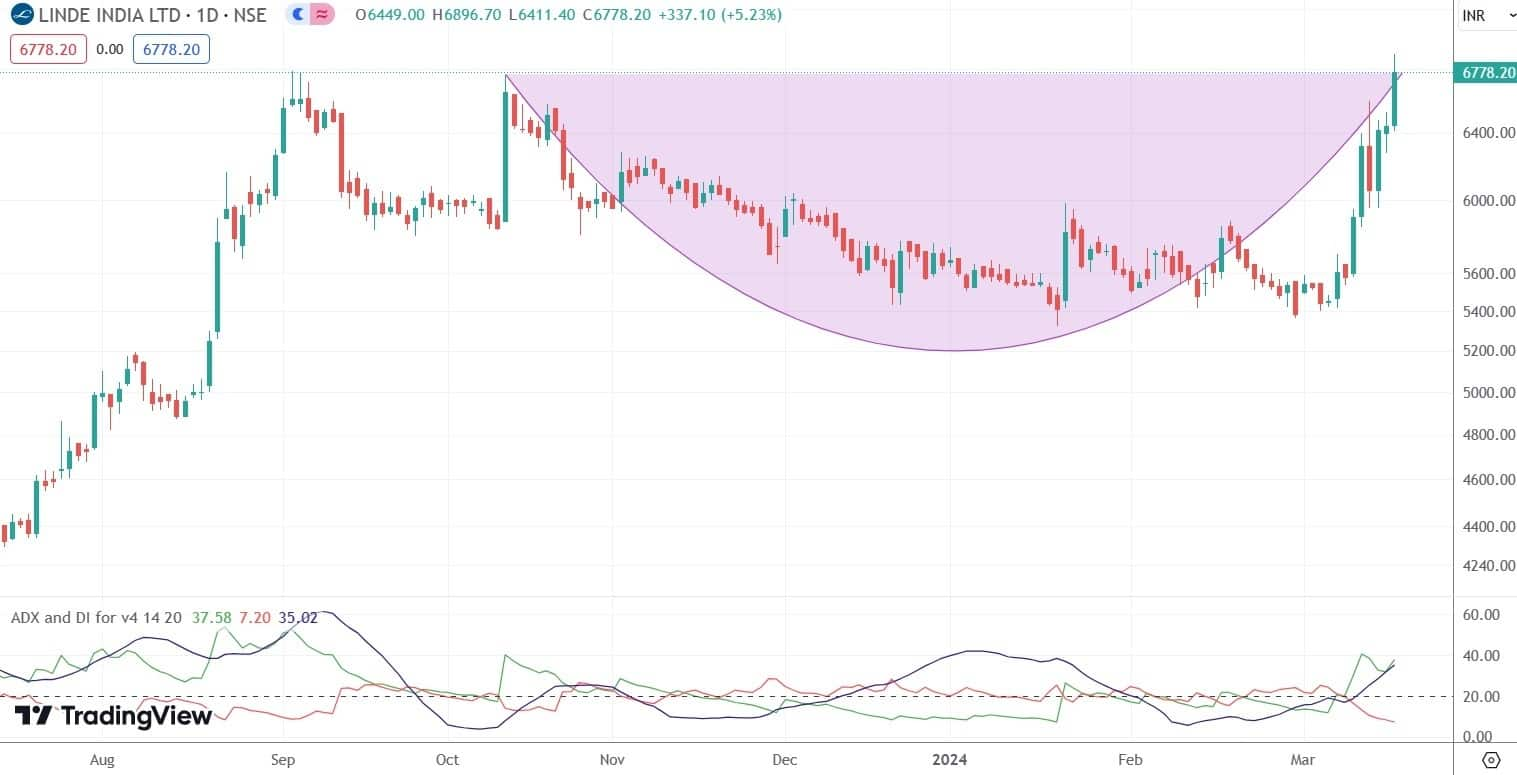
Linde India rose 5.2 percent to end at a record closing high of Rs 6,778 and formed a strong bullish candlestick pattern on the daily charts with significantly higher volumes. The stock traded above all key moving averages and continued higher highs, higher lows formation for yet another session.
Here's what Ashish Kyal of Waves Strategy Advisors recommends investors should do with these stocks when the market resumes trading today:
In the previous session, prices bounced back on the upside precisely from the trendline which is visible on the below chart. Support as per this comes near Rs 2,910 levels. As long as the price trades above it, further buying can be seen.
In the below chart, we have also shown Bollinger Bands, wherein prices reversed from the mid-bands and moved up. So, with follow-up buying, we can expect a move towards upper bands in the coming weeks which is near Rs 3,400 levels.
In short, the overall tone for Godfrey Phillips is bullish. A breach above Rs 3,190 is a must for further bullish momentum to continue with the targets of Rs 3,310 followed by Rs 3,400 levels. On the downside, Rs 2,910 is the key support level.
Linde India has been moving higher recently and intact in a strong uptrend. On the daily chart, the price has closed above Rs 6,765 level which confirms the breakout of the rounding bottom pattern.
We have shown the ADX (average directional index) indicator which gives an indication if the stock is trending or in a trading range. The low readings of ADX indicate that the stock is in a range. The ADX of this stock is 35.02 giving an indication of a trending market. A reading above 25 means strong directional strength.
In short, the trend for this stock is positive. Use dips towards Rs 6,680-6,730 as a buying opportunity for a move towards Rs 7,400-7,500 levels as long as Rs 6,350 holds on the downside.
In the below chart, we can see that the stock reversed from the important support which was near Rs 3,715 levels. After which prices crossed above the EMA (exponential moving average) trend cloud indicator, and since then prices managed to sustain above it.
EMA trend cloud indicator helps to understand the short-term trend. The indicator suggests that the overall trend has changed to positive. However, prices were trading in a range of Rs 3,530-3,715 in the past 1 month.
In the previous session, prices gave the break-out of the consolidation and also closed well above the consolidation range which is a positive sign.
In short, the trend for PI Industries is positive. A break above Rs 3,770 is a must for fresh buying to emerge with the targets of Rs 3,890 followed by Rs 3,930 levels, as long as Rs 3,600 holds on the downside.
Follow Ashish Kyal on Twitter - @kyalashish
Disclaimer: The views and investment tips expressed by investment experts on Moneycontrol.com are their own and not those of the website or its management. Moneycontrol.com advises users to check with certified experts before taking any investment decisions.
Discover the latest business news, Sensex, and Nifty updates. Obtain Personal Finance insights, tax queries, and expert opinions on Moneycontrol or download the Moneycontrol App to stay updated!