
Prime Minister Narendra Modi and his ministers say that India is now in its "amrit kaal" (golden age) and on course to becoming a developed nation by 2047 - the 100th year of its independence. They also underscore India's economic transformation from "Fragile 5" under Congress-led UPA to top 5 under BJP-led NDA. But do the numbers concur?
These 7 charts tell India's growth story vis-a-vis key economic indicators since 2014:
People are buying houses faster than 10 years ago. It’s showing up in home loans
Household spending on creating assets is a function of people’s income. The key determinant of a family’s decision to buy a house is not as much as current income, but more about what it thinks about its future income.
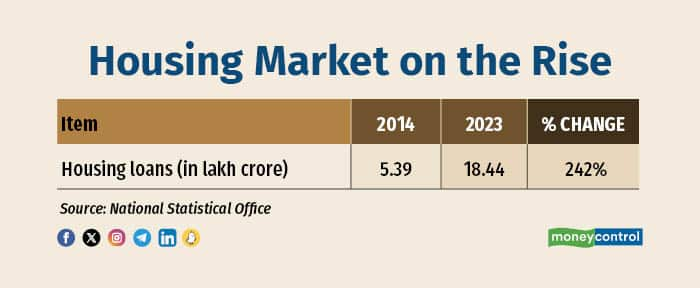
Most houses, particularly in the urban areas, are bought on loans. A commitment to buy a house would imply that the family feels confident about its ability to fund it over a 10-15 year period. The home loan statistics can be a good marker to gauge this.
Between 2014 and 2023, housing loans have grown 241 per cent—from Rs 5.4 lakh crore to Rs 18.4 lakh crore, clearly demonstrating greater current spending ability and the confidence about future income.
Airports have doubled. Millions more taking to skies. It can be seen on flight status display boards
Tier-2 towns and cities now clearly outnumber the metro and state capital destinations as more Indians are taking to the skies. The data reinforces this. The commercial fleet strength in India has gone up from 395 in 2014 to 714 in 2023, vaulting by nearly 81 per cent, as millions criss-cross across the country's firmament. In 2014, there were 74 airports in the country.
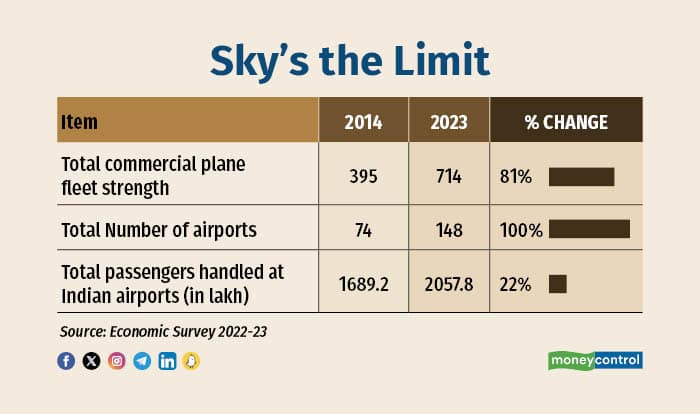
In 2023, there were 148 functional airports in India, double the number of what it was 10 years ago. One can often spot these on the flight status display boards at airports.
Financialisation of savings has deepened. Mofussils are matching metros in equity play
How are people's savings behaviour changing in the rural areas.? The Indian equity market added around 15.69 million investors in 2023, with Uttar Pradesh leading the pack with 2.31 million, outgrowing Maharashtra. Maharashtra, however, retains the largest investor base at 14.9 million, while Uttar Pradesh and Gujarat come next with 8.9 million and 7.7 million investors.
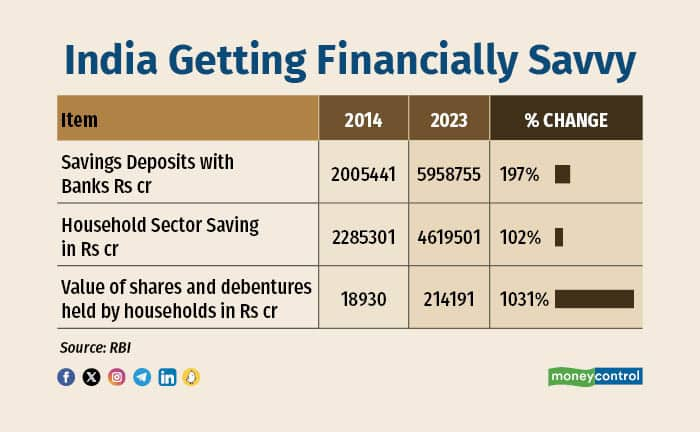
The heartland is getting financially savvy. Digitisation of financial systems and deeper bank penetration is transforming people's savings behaviour, from locking up money in physical assets such as gold or stocking up cash, to more return-yielding financial assets.
Value of shares and debentures held by households jumped 1031 per cent during 2014-23—from Rs 18,930 crore to Rs 2,14,191 crore. Mutual funds’ assets under management have vaulted 378 per cent – from Rs 8,25,240 crore in 2014 to Rs 39,42,031 crore in 2023.
Savings deposits have galloped from Rs 20,05,441 crore in 2014 to Rs 59,58,755 crore—soaring by 197 per cent. A large part of this may have been driven by the PM Jan Dhan Yojana (PMJDY), the world’s largest financial inclusion scheme launched in 2014. In 2014, an estimated four out of 10 ten adults in India did not have a bank account. In January 2024, there were 51.50 crore PMJDY accounts, with Rs 215,803.17 crore lying in these accounts.
BSE market cap now above $ 4 trillion, fifth largest in the world
The equity markets have grown by several multiples over the last 10 years.
The Bombay Stock Exchange (BSE) market capitalisation has crossed USD 4 trillion recently, a nearly four-times climb from the levels of USD 1.1 trillion in 2014. The BSE Sensex has nearly tripled—from 24,000 levels in 2014 to more than 73,000 now.
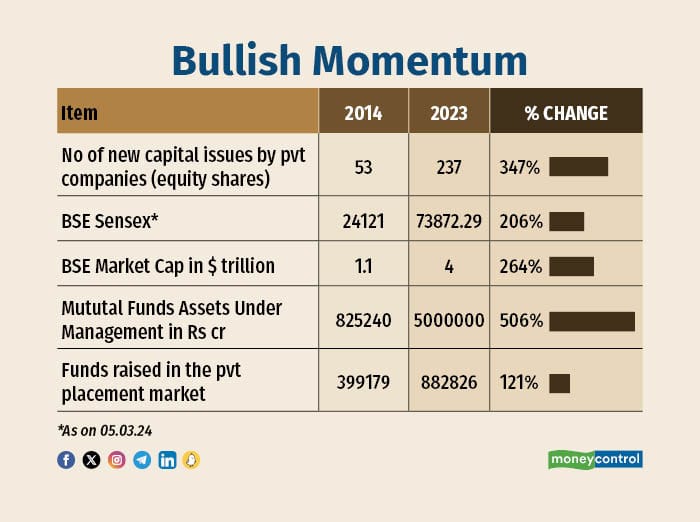
Mutual funds’ assets under management (AUM) have more than 500 per cent from Rs 8.25 lakh crore to more than Rs 50 lakh crore now.
Funds raised in the private placement market has increased more than 120 per cent—from Rs 3.99 lakh crore in 2014 to Rs 8.82 lakh crore in 2023.
GDP gallops from Fragile Five in 2013 to Fifth Largest in 2023
In 2013, Morgan Stanley described India as “Fragile Five” to represent emerging market economies that have become too dependent on unreliable foreign investment to finance their growth ambitions. The five members of the Fragile Five included Turkey, Brazil, India, South Africa and Indonesia.
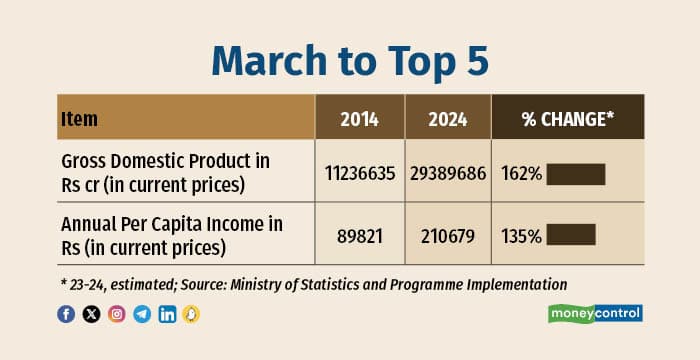
In 2023, India moved up to become the world’s fifth largest economy. India’s GDP at current prices has grown nearly three-and-a-half times—from Rs 1,12,36,635.0 crore in 2014 to Rs 2,72,40,712 crore in 2023-24, rising by 162 per cent.
During this period, the average income of an Indian more than doubled or by 135 per cent. The annual per capita income—the level of income that an Indian on average earns in a year—grew from Rs 89,821 in 2013-14 to Rs 2,10, 679 in 2023-24.
Highways of growth unleashes strong multipliers in 10 years
India’s infrastructure creation has gathered significant speed over the last few years. A large part of this draws from the government’s policy on focusing on capital expenditure, relying heavily on the textbook assumption that higher public or government investment in infrastructure projects will unleash strong economic multipliers. By definition, the resultant impact of infrastructure projects always shows up with a time lag. Highways and ports are long gestation projects, but can spin jobs, with cascading benefits on intermediate industries such as cement and steel.
The government’s decision to do the heavy lifting on capital expenditure appears to be a part of the well-crafted medium-term strategy to not just accelerate the pace of infrastructure project execution, but also to trigger a cycle of private sector investment, or what economists sometimes describe as the “crowding in” phenomenon.
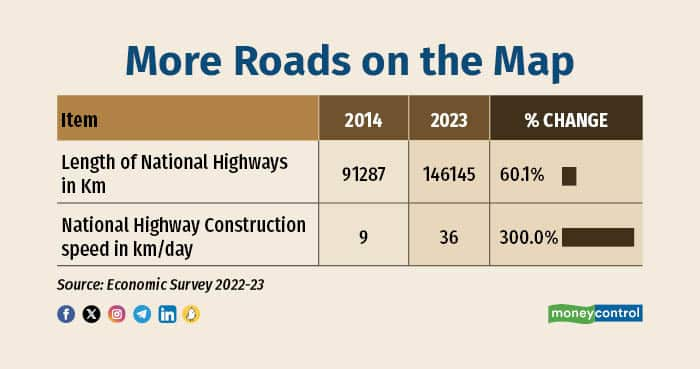
The length of highways has grown from 91,287 km in 2014 to 1,46,145.0 km in 2023. An average of 36 kilometers of highways are built now in a day, four times the speed of nine kilometres in 2014. The ship turnaround time in ports have also fallen from an average of 4.3 days in 2014 to 2.1 days now.
War-chest of forex reserves now $619 billion strong and counting
The United States (US) dollar remains the most dominant currency in the world. In general, trade can be invoiced in either of three currencies, i.e., in the home currency of the exporter, in the currency of the importer, or in the currency of a third country known as ‘vehicle’ currency.
However, most often, it is the US dollar (or sometimes the euro) that constitutes a considerable proportion of global trade transaction invoicing irrespective of the countries involved in the trade, where prices are set in dollars.
In the case of India, 86 percent of its imports are invoiced in dollars, while only 5 percent of India's imports originate in the US. While China makes up 16 percent of India's imports these are mainly invoiced in dollars.
For example, the rupee price and volume of India’s imports from China depend more on the rupee-dollar exchange rate than the rupee-yuan exchange rate if import prices from China are set in dollars. Recall that when prices are invoiced in dollars they tend to be sticky in dollars, which means that from India’s perspective the rupee price moves with the rupee-dollar exchange rate and not the rupee-yuan exchange rate, which is why building adequate foreign exchange (forex) reserves are essential.
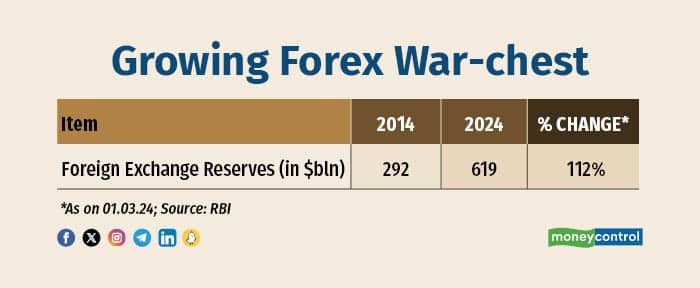
India’s foreign exchange reserves have surged 112 per cent since 2014— from USD 292 billion in 2014 to more than USD 623 billion in March 2024.
Discover the latest business news, Sensex, and Nifty updates. Obtain Personal Finance insights, tax queries, and expert opinions on Moneycontrol or download the Moneycontrol App to stay updated!