The Nifty has experienced breakdown from a rising channel on the daily chart, signalling the conclusion of the previous uptrend and the potential beginning of a downtrend. This breakdown is supported by the moving average as well, the index has dipped below the crucial near-term moving average, and the 21-day exponential moving average (EMA).
Additionally, the index has skidded below the recent consolidation phase on the daily timeframe, further emphasising the increasing weakness. The relative strength index (RSI) with a period of 14 is showing a bearish crossover and has dropped below the 50 mark.
In the short term, the index may continue to be susceptible to selling pressure with likely resistance around 22,250. On the downside, support levels are seen at 21,800 and 21,700.
Meanwhile, the bears retained control in the banking space as the index encountered rejection at the 47,500 level, solidifying it as a formidable resistance zone. The index persists in a 'sell on rise' stance until this resistance is convincingly surpassed on a closing basis.
Breaching its 20-day moving average (20DMA) implies a subsequent wave of selling pressure, potentially pushing the index down towards the 46,000-45,500 range.
Here is one buy call and two sell recommendations for short term:
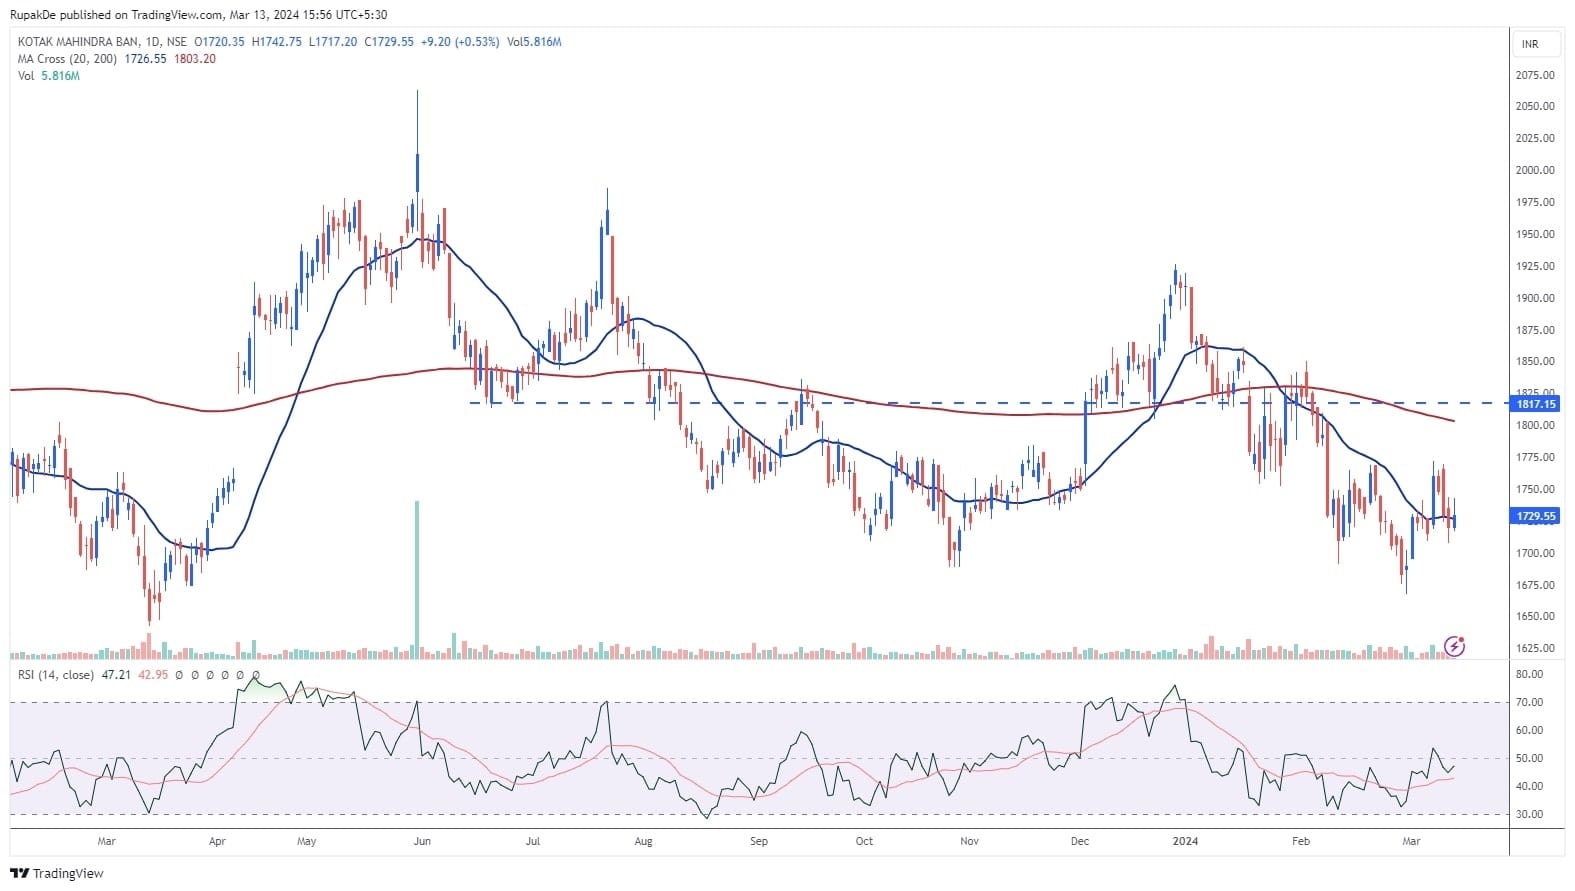
Kotak Mahindra Bank: Buy | LTP: Rs 1,729.55 | Stop-Loss: Rs 1,700 | Target: Rs 1,800 | Return: 4 percent
After a few days of weakness, the stock has closed with a Bullish Harami pattern (not a classic one) on the daily chart, indicating a potential bullish reversal. Additionally, the stock has recently closed above the near-term moving average on the daily chart, further affirming the bullish trend.
The relative strength index (RSI) on the daily timeframe shows a bullish crossover. Hence for the short term, the stock looks positive.
A decisive move above Rs 1,735 could propel the stock into a short-term rally, potentially reaching Rs 1,800. Support on the lower end is situated at Rs 1,700, below which the stock may resume its decline.

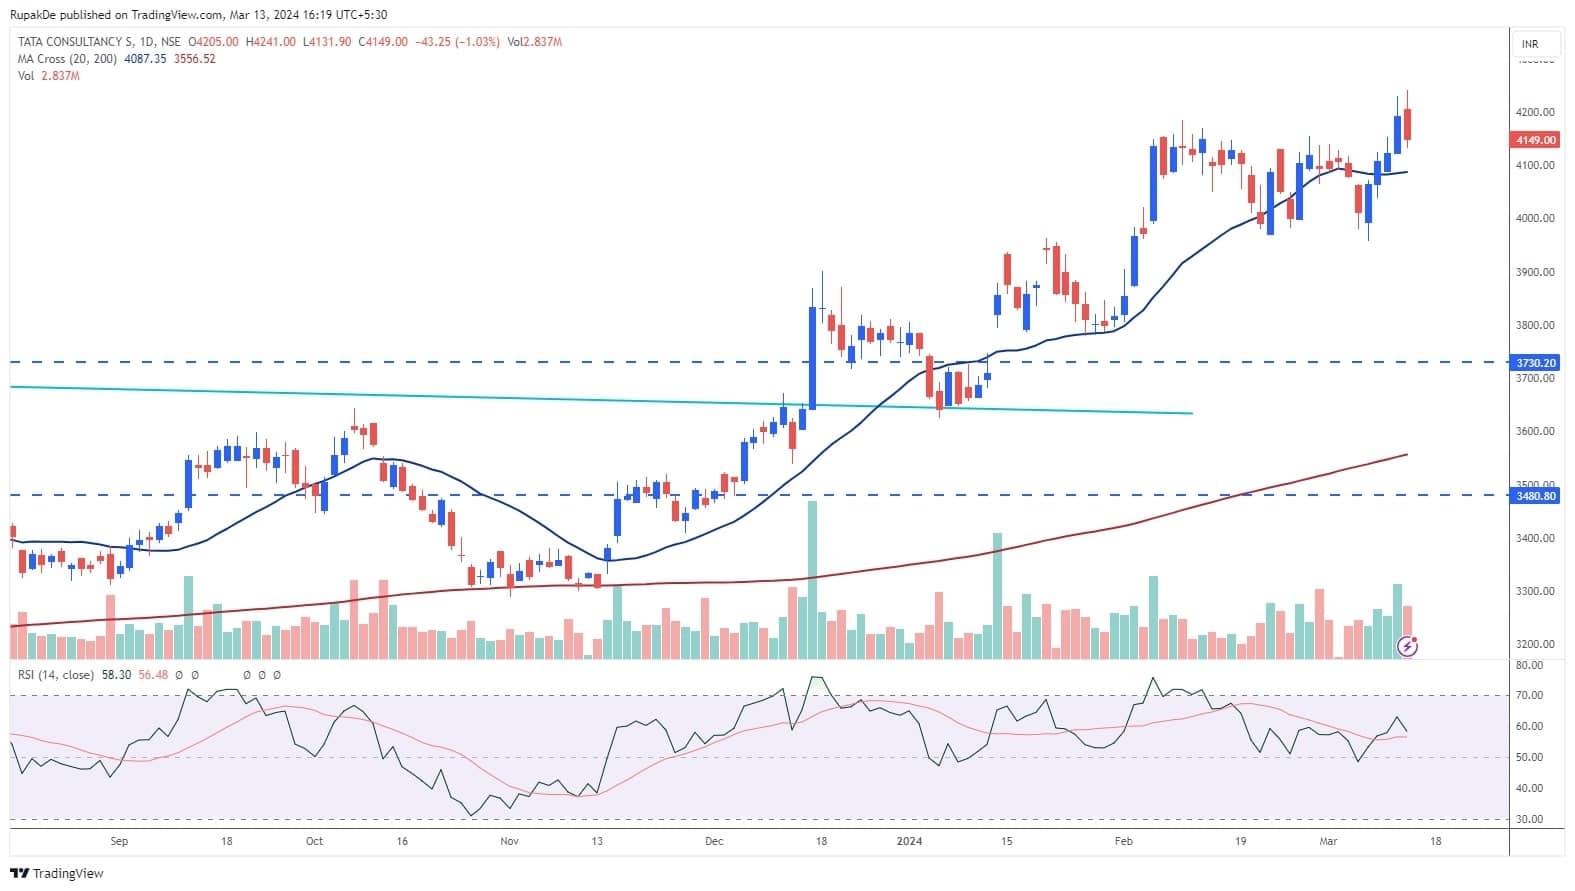
Tata Consultancy Services: Sell | LTP: Rs 4,149 | Stop-Loss: Rs 4,200 | Target: Rs 4,000/3,970 | Return: 4 percent
The stock has formed a Dark Cloud Cover pattern on the daily timeframe, indicating a potential bearish reversal following a rally. Additionally, the price has retreated into consolidation after breaking out from a previous consolidation phase.
The RSI is on the brink of a bearish crossover. The decline in price was accompanied by significant volume, suggesting broad-based participation in the selling pressure.
Therefore, in the short term, the outlook for the stock appears negative. A decisive move below Rs 4,130 could push the stock towards the levels of Rs 4,000/3,970. Resistance on the upper end is positioned at Rs 4,200, beyond which the stock may resume its upward movement.

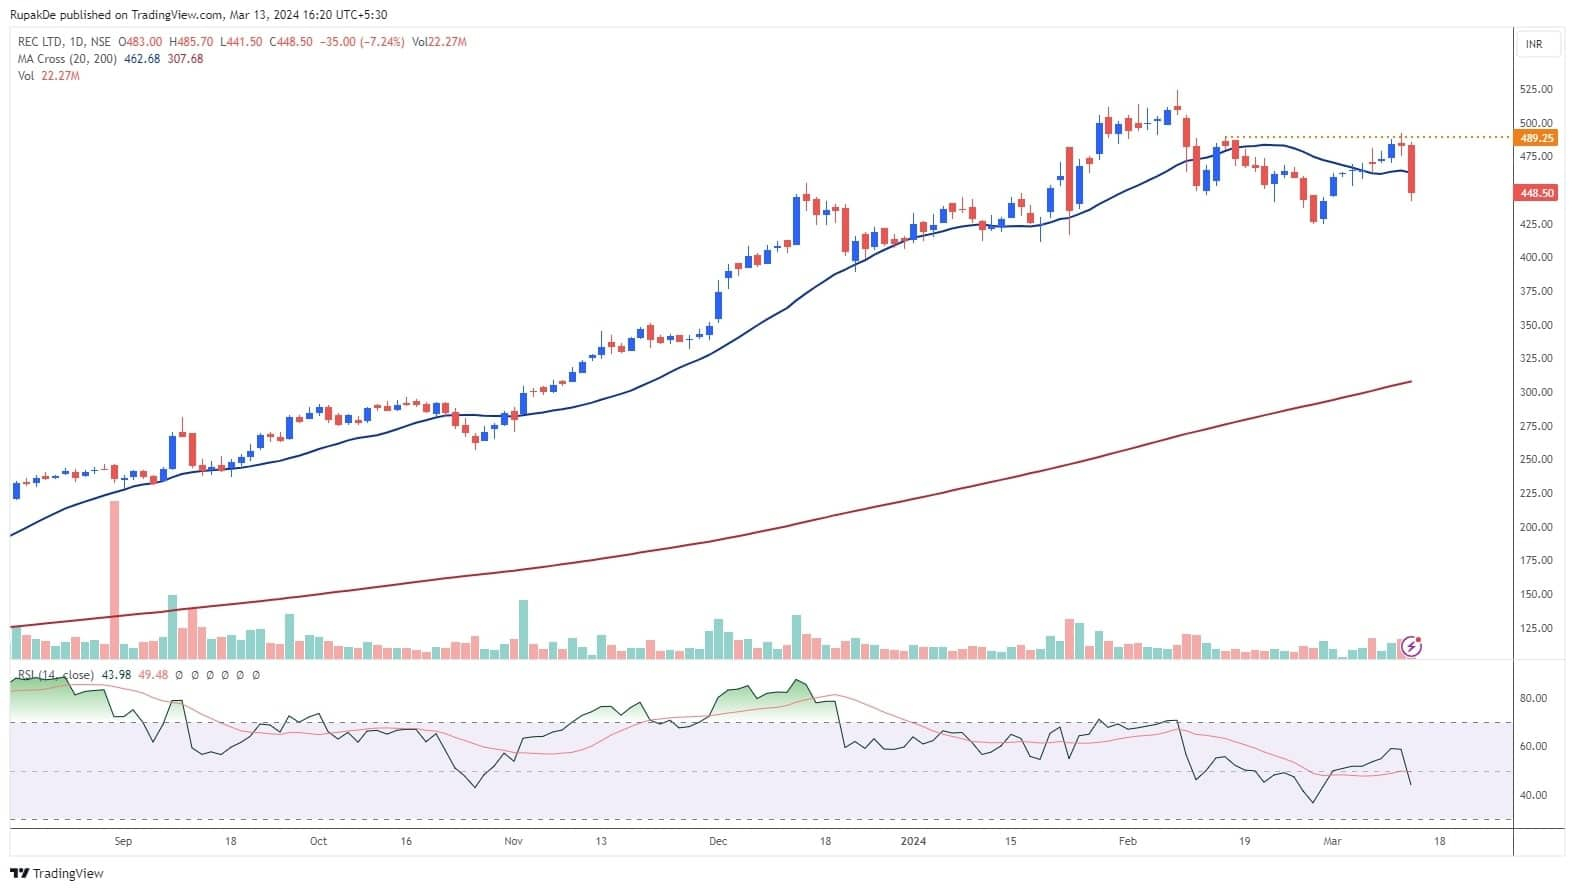
REC: Sell | LTP: Rs 448.5 | Stop-Loss: Rs 460 | Target: Rs 425 | Return: 5 percent
The stock has fallen sharply after a consolidation on the daily chart, suggesting a rise in weakness. The decline in price was accompanied by significant volume, suggesting broad-based participation in the selling pressure. Besides, the stock found resistance at the previous swing high before the recent fall.
The RSI is in a bearish crossover. Therefore, in the short term, the outlook for the stock appears negative.
A decisive move below Rs 448 could push the stock towards the levels of Rs 425. Resistance on the upper end is positioned at Rs 460, beyond which the stock may resume its upward movement.

Disclaimer: The views and investment tips expressed by investment experts on Moneycontrol.com are their own and not those of the website or its management. Moneycontrol.com advises users to check with certified experts before taking any investment decisions.
Discover the latest business news, Sensex, and Nifty updates. Obtain Personal Finance insights, tax queries, and expert opinions on Moneycontrol or download the Moneycontrol App to stay updated!